How good are the titrations?
In order to get an idea of the agreement between the results of
fifteen students, each having done three replicate measurements,
one could count how many titration results are not
further away than 0.005 M from the mean value of 0.1005 M. You
can verify this by clicking on the "Submit" box below. Next,
find how many results differ less than 0.0017 M, the standard
deviation, from the true value. How many are closer to the mean
value than 2 times and 3 times the standard deviation?
The reverse procedure is also possible. Using the next "Submit"
button, you can calculate what interval around the mean value
contains 95% of all titration results.
From the past to the future...
The principal idea in statistics is the notion that more or less
the same results would be expected if the same group of students
would perform the same titrations again. Although the individual
results would be different, the
distribution of the
results would be similar. The distribution of the measurements is
often approximated by a normal distribution. This is completely
defined by only two values: the mean and the standard deviation of
the distribution. The spread around the mean value, as measured by
the standard deviation, is directly related to the width of a confidence
interval. Now, what is a confidence interval anyway?
Confidence intervals
A confidence interval of 95 percent simply means that we expect 95% of all
future measurements to fall within this interval. This also means that
5% of all measurements are expected to fall outside! Likewise, confidence
intervals of 90% and 99% are often used. The exact calculation of a
confidence interval requires a bit of background which is beyond this
course; however, approximate values for confidence intervals can easily
be explained. We already hinted that the width of a confidence interval
is related to the standard deviation of the data. Now, as a rule of
thumb, a confidence interval of 95% is obtained by taking the mean
plus or minus
twice the standard deviation. A confidence interval
of 99% (approximately) is given by the mean plus or minus
three times
the standard deviation.
Question: why are 99% confidence intervals
wider than 95% confidence intervals?
We now see that confidence intervals routinely are constructed
from previous data. This implies that the intervals are only valid
if we expect the future data to behave in the same way!
The confidence interval of the mean
We have discussed confidence intervals for individual measurements.
A 95-percent confidence interval for individual measurements implies
that there is a 95 percent chance that another titration experiment
would find a value in that range (provided it is executed in exactly
the same way as all the other volume determinations, and by the same
people).
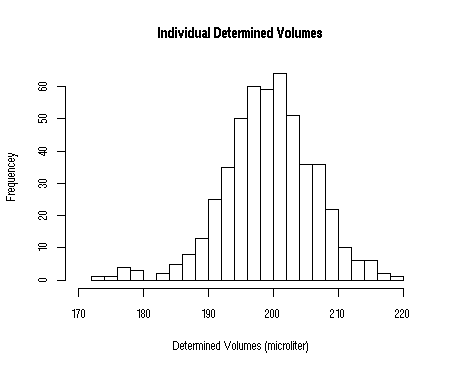
However, each student performed 10 volume determinations, and took the mean value
of these as the final result. Obviously, the histogram of all these
mean values shows considerably less variation than the individual
volume determinations (remember, errors cancel out!). This means that the
standard deviation
of a mean value is smaller than the
standard deviation
for individual values.
The histograms of the individual measurements and the mean values
are depicted below.
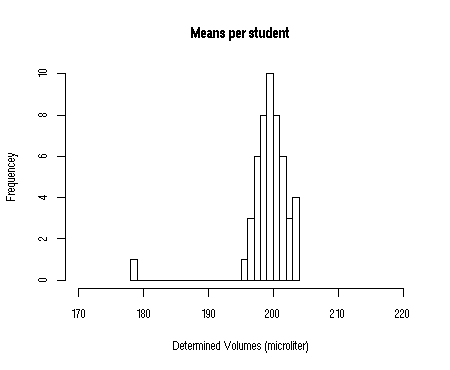
Clearly, there is one student with a quite low mean value.
The means of the other students are very close indeed.
The relation between the standard deviation of the individual titration
results and the standard deviation for mean values is given by
where
n is the number of measurements used to calculate the mean. σ, the Greek lowercase letter sigma, is often used as the symbol for the standard deviation and μ, the Greek lowercase letter mu, as the symbol for the mean (but the latter one is not shown here...).
Confidence intervals
for the mean are calculated in exactly the
same way as confidence intervals for individual measurements, only
the standard deviation for the mean is used instead of the standard
deviation of the individual measurements.
This formula also explains why the mean is more precise when we use
more data: its confidence interval becomes narrower. Again, note that this
does not mean that the standard deviation of the individual
measurements gets smaller!
The limit of detection
A direct application of confidence intervals is the determination of
the limit of detection (LOD) of quantitative analytical methods.
A definition of the LOD is: the LOD is the smallest signal value
that is significantly (e.g. with 99% confidence) different from
the signal of a true blank. To assess the LOD, a sufficient number
of true blank values should be measured (preferably more than 20). The
LOD is then equal to the mean plus three times the standard deviation.
In this way, you are 99% sure that a sample yielding a larger signal
value than the LOD is not a blank.
